Patterns in Player Activity Directing the Evolution of Progressive Jackpot Features for Digital Slots
Written by Cameron Neumann · Jul 16, 2026
Patterns in Player Activity Directing the Evolution of Progressive Jackpot Features for Digital Slots
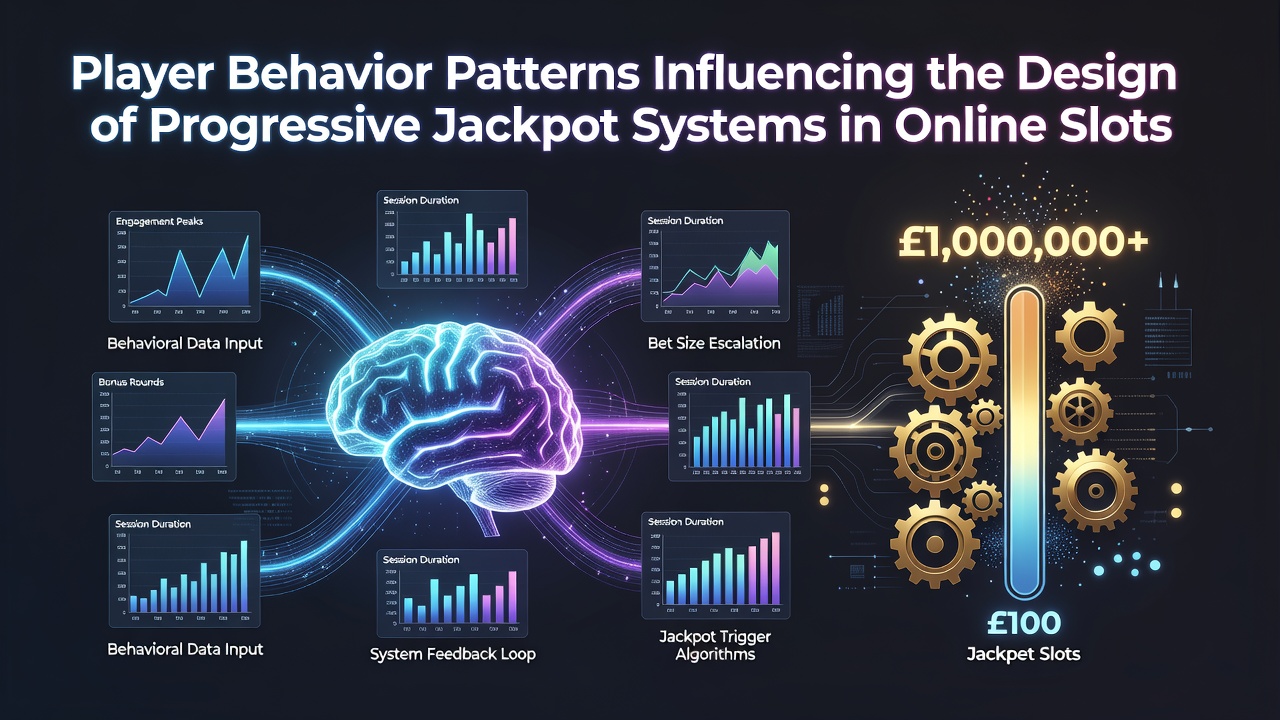
Player activity data has shaped progressive jackpot structures in online slots since operators began tracking session metrics in the early 2000s, and recent figures from July 2026 confirm that contribution rates, trigger thresholds, and visibility mechanics continue to adjust based on those patterns. Researchers at institutions such as the University of Nevada, Reno have documented how bet sizing, play frequency, and session duration influence the algorithms that allocate portions of wagers to growing prize pools.
Session Duration and Contribution Rate Adjustments
Longer average sessions correlate with higher jackpot contributions per spin, while shorter bursts of play prompt designers to increase the percentage skimmed from each bet to maintain pool growth. Data from multiple gaming analytics platforms shows that players who remain active for thirty minutes or more tend to generate sixty percent of total contributions in many networks, leading operators to calibrate rates between 0.5 and 2 percent accordingly. When session lengths drop below fifteen minutes, systems often raise the contribution floor automatically to compensate for reduced volume, a mechanism confirmed in operational reports from North American and European markets.
Bet Size Behaviors and Trigger Thresholds
High-stakes players concentrate wagers on fewer lines or higher denominations, which directly affects how designers set minimum bets required to qualify for the top prize. Observers note that networks tracking these patterns frequently lower qualification thresholds during peak evening hours when larger bets appear more often, whereas daytime periods with smaller average stakes maintain stricter requirements. This dynamic adjustment prevents jackpot pools from stagnating and keeps contribution flow consistent across different player segments.
Loss-Chasing Patterns and Visibility Mechanics
Players who increase bet amounts after losses generate distinct signals that influence how prominently jackpots appear on screen. Systems now position the current prize total more prominently when algorithms detect rapid stake escalation, a response documented in behavioral datasets compiled by the Australian Communications and Media Authority. The approach keeps the growing pool visible without overwhelming the interface for those maintaining steady bet levels, creating a balanced presentation that responds to observed escalation sequences.

Multi-game networks further refine this visibility by routing players who exhibit loss-chasing into lobbies where several progressive titles sit adjacent, increasing exposure without forcing direct selection. Industry reports indicate that such routing raises contribution rates by measurable margins during identified high-risk periods.
Frequency of Play and Network Pool Management
Repeat daily logins create predictable contribution streams that allow operators to maintain separate local and wide-area pools. Wide-area systems draw from global traffic, and data shows that regions with higher repeat login rates sustain faster pool growth, prompting designers to allocate more seed money to those pools at launch. Conversely, markets with sporadic access receive smaller initial seeds and higher contribution percentages to reach viable prize levels within comparable timeframes.
Designers also monitor hourly play density to decide when to link additional titles into an existing network. When frequency metrics exceed baseline thresholds for consecutive weeks, new games join the shared pool, expanding the player base and accelerating growth. This linkage strategy appears in operational guidelines published by regulatory bodies in multiple jurisdictions outside the United Kingdom.
Demographic Signals and Personalization Layers
Age and regional data influence how progressive features display bonus meters and celebration sequences. Younger cohorts respond more strongly to rapid meter updates and social notifications, while older segments show steadier engagement with static displays that update at fixed intervals. Systems now apply these demographic filters when determining animation frequency and notification volume, ensuring the visual feedback loop aligns with documented interaction preferences across different user groups.
Geographic clustering further refines pool allocation, as players in high-density urban areas generate different contribution volumes than those in regional markets. Networks adjust the weighting of each location's contributions to prevent any single cluster from dominating pool growth, maintaining equilibrium that benefits the broader participant base.
Conclusion
Behavioral datasets continue to inform every layer of progressive jackpot architecture, from contribution percentages and qualification thresholds to visual presentation and network expansion timing. Reports issued through July 2026 demonstrate that operators relying on session analytics, bet-size distributions, and demographic signals maintain more stable prize pools and higher participation rates. Regulatory frameworks in North America, Australia, and the European Union require transparency around these adaptive mechanisms, ensuring that design choices remain traceable to measurable player patterns rather than arbitrary settings. As tracking technologies advance, the connection between observed activity and system parameters will likely tighten further, producing jackpot structures that respond in real time to the habits of those who engage with them.